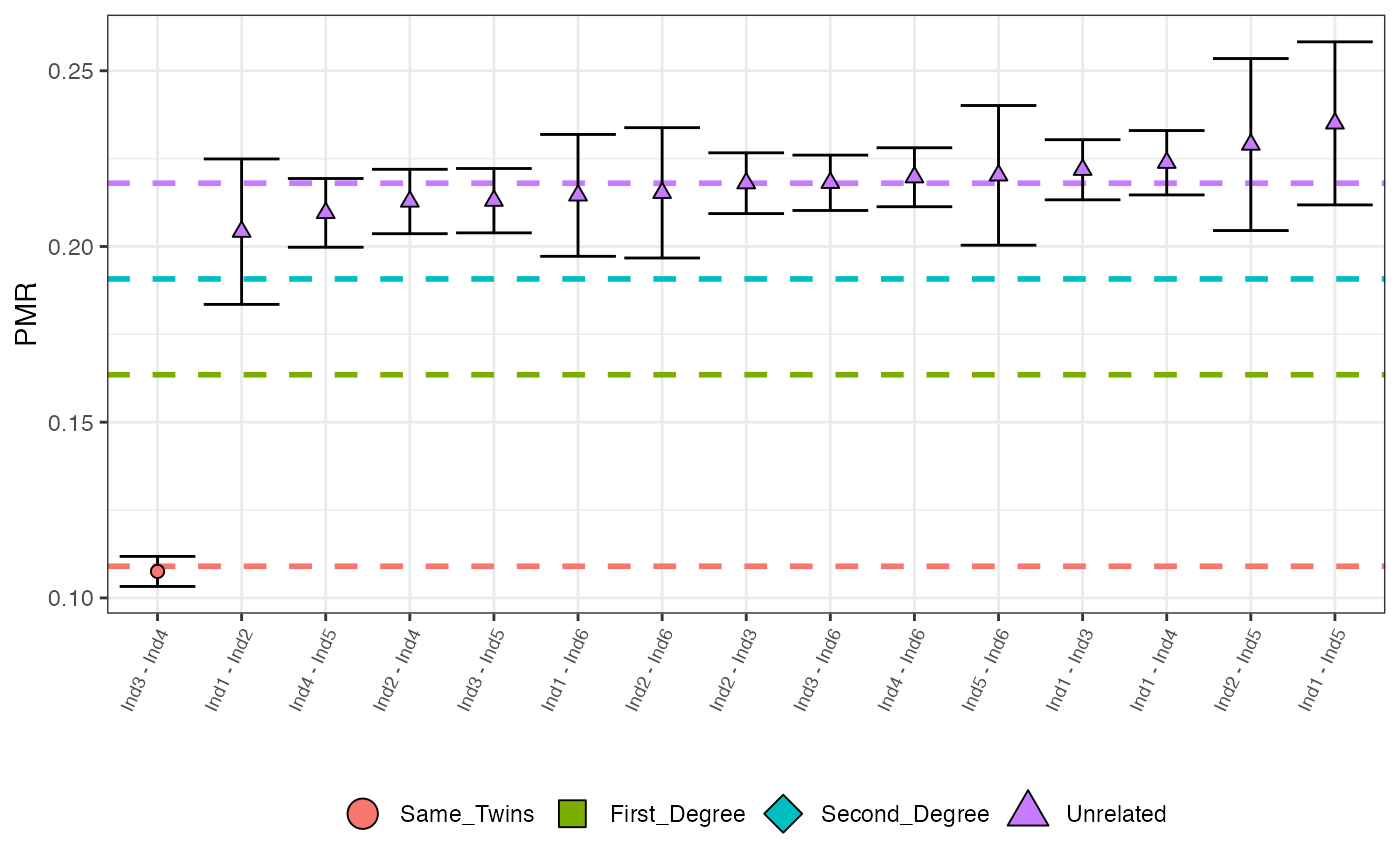
Plots all (sorted by increasing value) observed PMR values with maximum posterior probability classifications represented by colour and shape. Options include a cut off for the minimum number of overlapping SNPs, the max number of pairs to plot and x-axis font size.
Arguments
- in_tibble
a tibble that is the output of the callRelatedness() function.
- nsnps_cutoff
the minimum number of overlapping SNPs for which pairs are removed from the plot. If NULL, default is 500.
- N
the number of (sorted by increasing PMR) pairs to plot. Avoids plotting all pairs (many of which are unrelated).
- fntsize
the fontsize for the x-axis names.
- verbose
if TRUE, then information about the plotting process is sent to the console
Examples
relatedness_example
#> # A tibble: 15 × 12
#>      row pair       relationship   pmr      sd mismatch nsnps ave_rel Same_Twins
#>    <int> <chr>      <fct>        <dbl>   <dbl>    <dbl> <dbl>   <dbl>      <dbl>
#>  1     1 Ind1 - In… Unrelated    0.204 0.0103       310  1518   0.218  6.71e- 26
#>  2     2 Ind1 - In… Unrelated    0.222 0.00428     2093  9435   0.218  1.22e-214
#>  3     3 Ind1 - In… Unrelated    0.224 0.00458     1854  8283   0.218  2.00e-194
#>  4     4 Ind1 - In… Unrelated    0.235 0.0116       314  1336   0.218  2.68e- 37
#>  5     5 Ind1 - In… Unrelated    0.215 0.00867      481  2242   0.218  9.82e- 46
#>  6     6 Ind2 - In… Unrelated    0.218 0.00432     1988  9119   0.218  5.06e-195
#>  7     7 Ind2 - In… Unrelated    0.213 0.00458     1699  7984   0.218  4.95e-156
#>  8     8 Ind2 - In… Unrelated    0.229 0.0122       270  1179   0.218  1.80e- 30
#>  9     9 Ind2 - In… Unrelated    0.215 0.00927      423  1965   0.218  1.10e- 40
#> 10    10 Ind3 - In… Same_Twins   0.108 0.00214     2253 20952   0.218  1   e+  0
#> 11    11 Ind3 - In… Unrelated    0.213 0.00458     1703  7994   0.218  6.83e-157
#> 12    12 Ind3 - In… Unrelated    0.218 0.00394     2398 10994   0.218  2.05e-235
#> 13    13 Ind4 - In… Unrelated    0.210 0.00489     1451  6924   0.218  1.92e-127
#> 14    14 Ind4 - In… Unrelated    0.220 0.00419     2141  9745   0.218  2.95e-214
#> 15    15 Ind5 - In… Unrelated    0.220 0.00994      383  1739   0.218  3.64e- 39
#> # ℹ 3 more variables: First_Degree <dbl>, Second_Degree <dbl>, Unrelated <dbl>
plotLOAF(relatedness_example)
#> No minimum number of overlapping SNPs given.
#> Using default minimum of 500.
#> No upper limit on number of pairs to plot given.
#> Plotting first 15 pairs.