Final version is based on BR's version
Usage
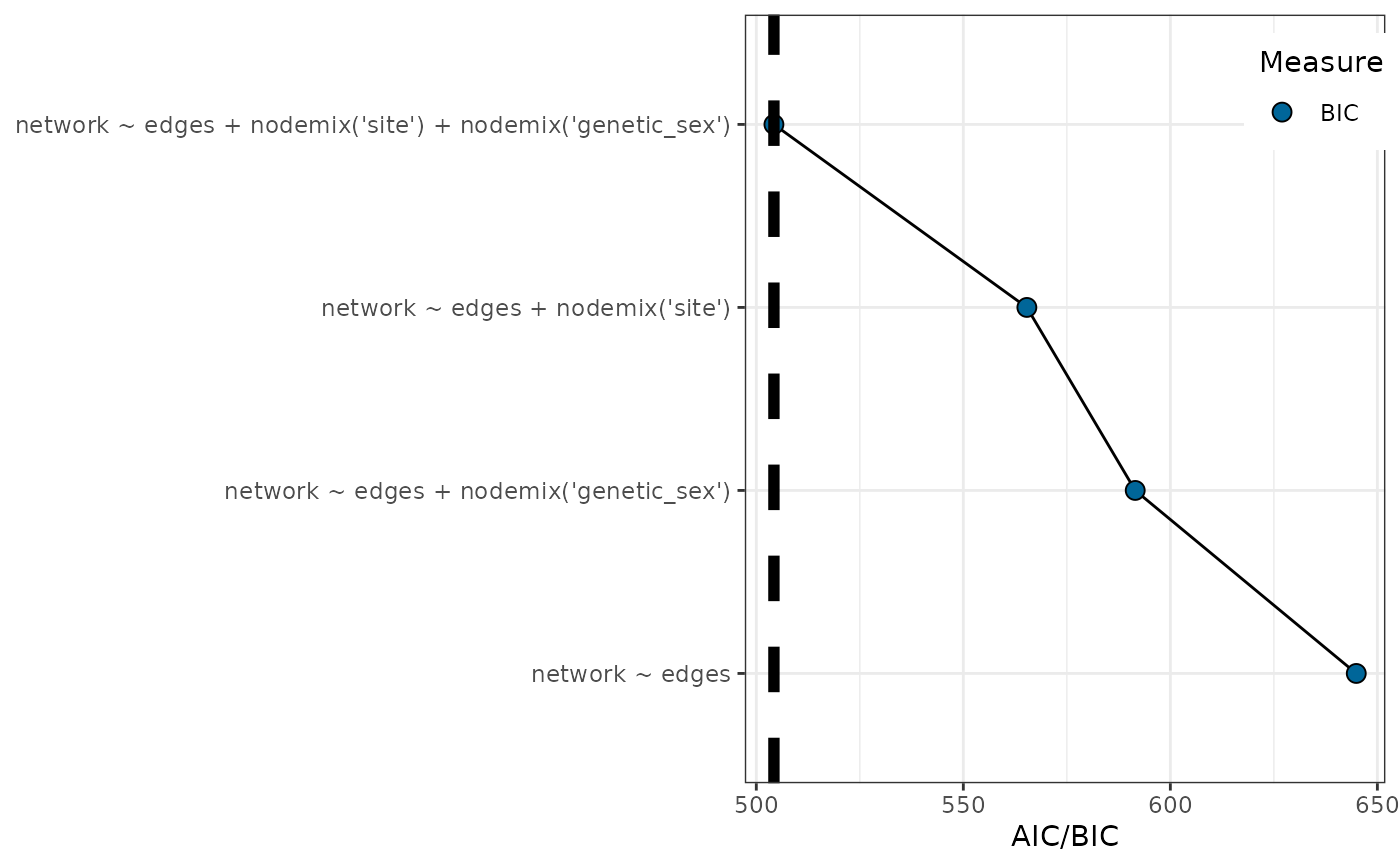
plot_ergm_bic(
  ergms,
  text_size = 10,
  text_angle = 90,
  abbr = FALSE,
  measure = "BIC",
  top_5 = FALSE
)Examples
ergms <- example_network |>
  get_ergms(
    preds = c("site", "genetic_sex"),
    types = c("nodematch", "nodemix"))
#> Starting maximum pseudolikelihood estimation (MPLE):
#> Obtaining the responsible dyads.
#> Evaluating the predictor and response matrix.
#> Maximizing the pseudolikelihood.
#> Finished MPLE.
#> Evaluating log-likelihood at the estimate.
#>
#> Starting maximum pseudolikelihood estimation (MPLE):
#> Obtaining the responsible dyads.
#> Evaluating the predictor and response matrix.
#> Maximizing the pseudolikelihood.
#> Finished MPLE.
#> Evaluating log-likelihood at the estimate.
#>
#> Starting maximum pseudolikelihood estimation (MPLE):
#> Obtaining the responsible dyads.
#> Evaluating the predictor and response matrix.
#> Maximizing the pseudolikelihood.
#> Finished MPLE.
#> Evaluating log-likelihood at the estimate.
#>
#> Starting maximum pseudolikelihood estimation (MPLE):
#> Obtaining the responsible dyads.
#> Evaluating the predictor and response matrix.
#> Maximizing the pseudolikelihood.
#> Finished MPLE.
#> Evaluating log-likelihood at the estimate.
#>
plot_ergm_bic(ergms) |> print()