Plots diagnostic plots
Examples
example_calls <- runChASM(rawReadCountsIn = example_data)
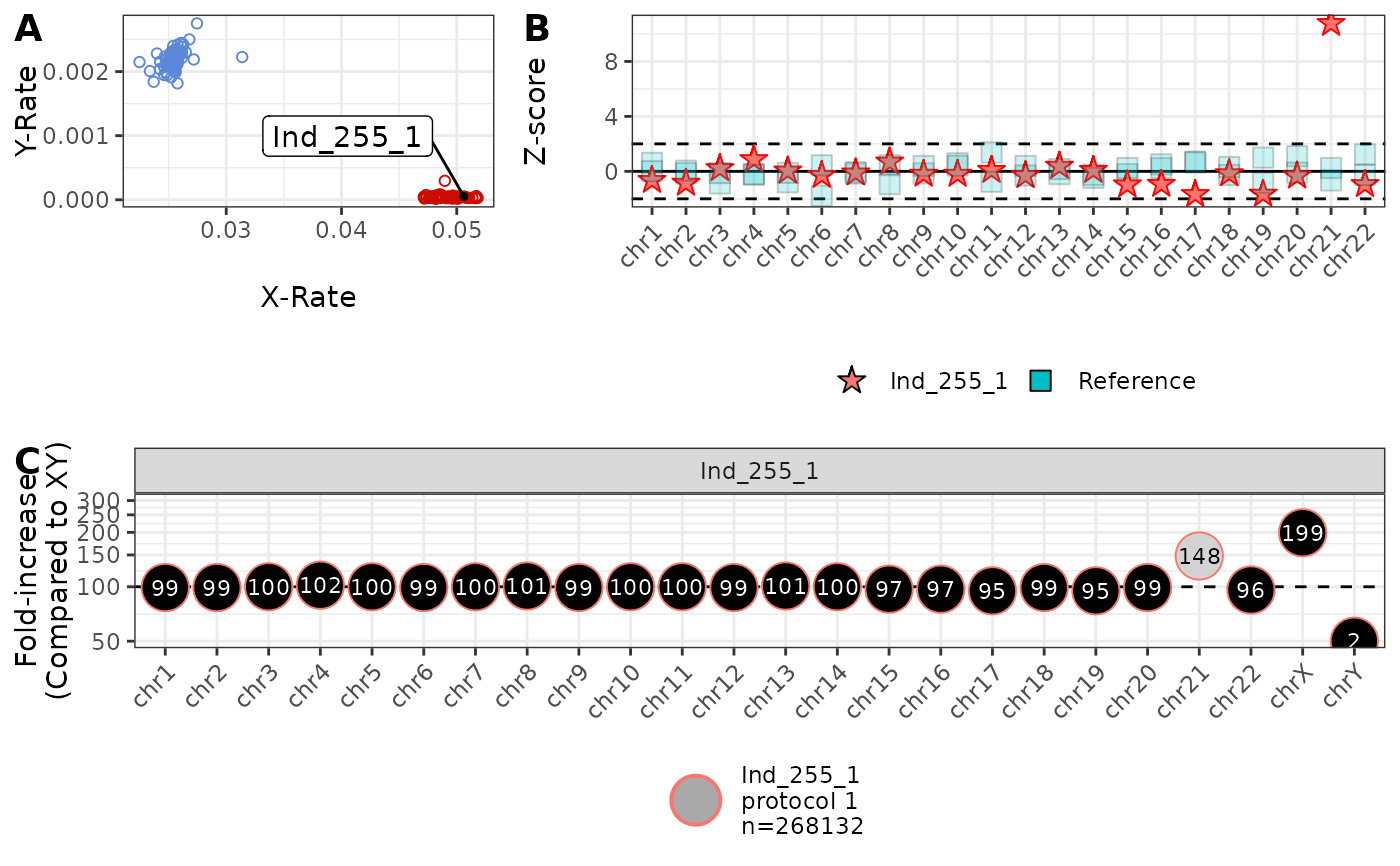
 plot_diagnostic(IDs = 'Ind_255_1', inChASM = example_calls, addLabels = TRUE)
#> Warning: Removed 1 row containing missing values or values outside the scale range
#> (`geom_text()`).
plot_diagnostic(IDs = 'Ind_255_1', inChASM = example_calls, addLabels = TRUE)
#> Warning: Removed 1 row containing missing values or values outside the scale range
#> (`geom_text()`).