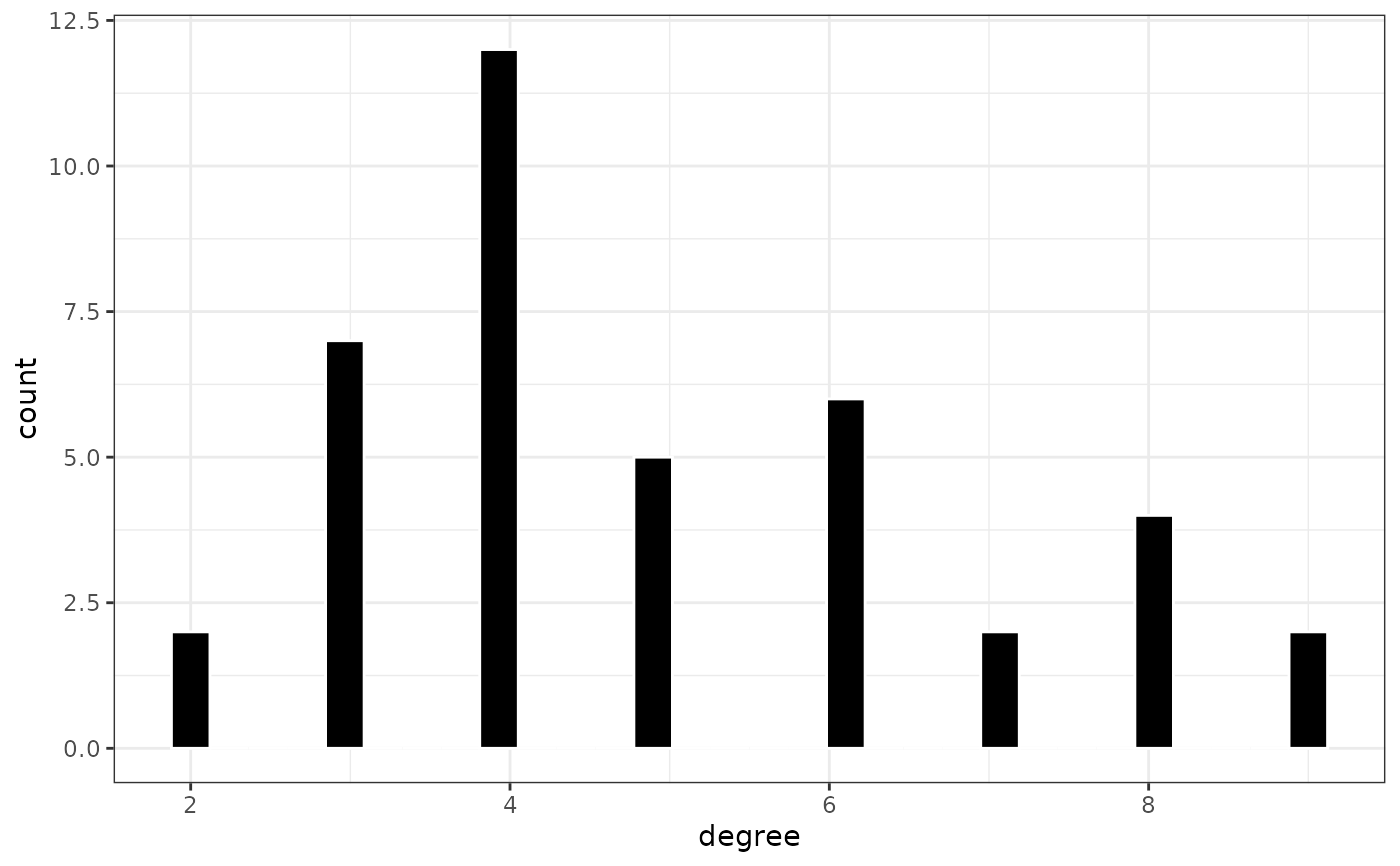
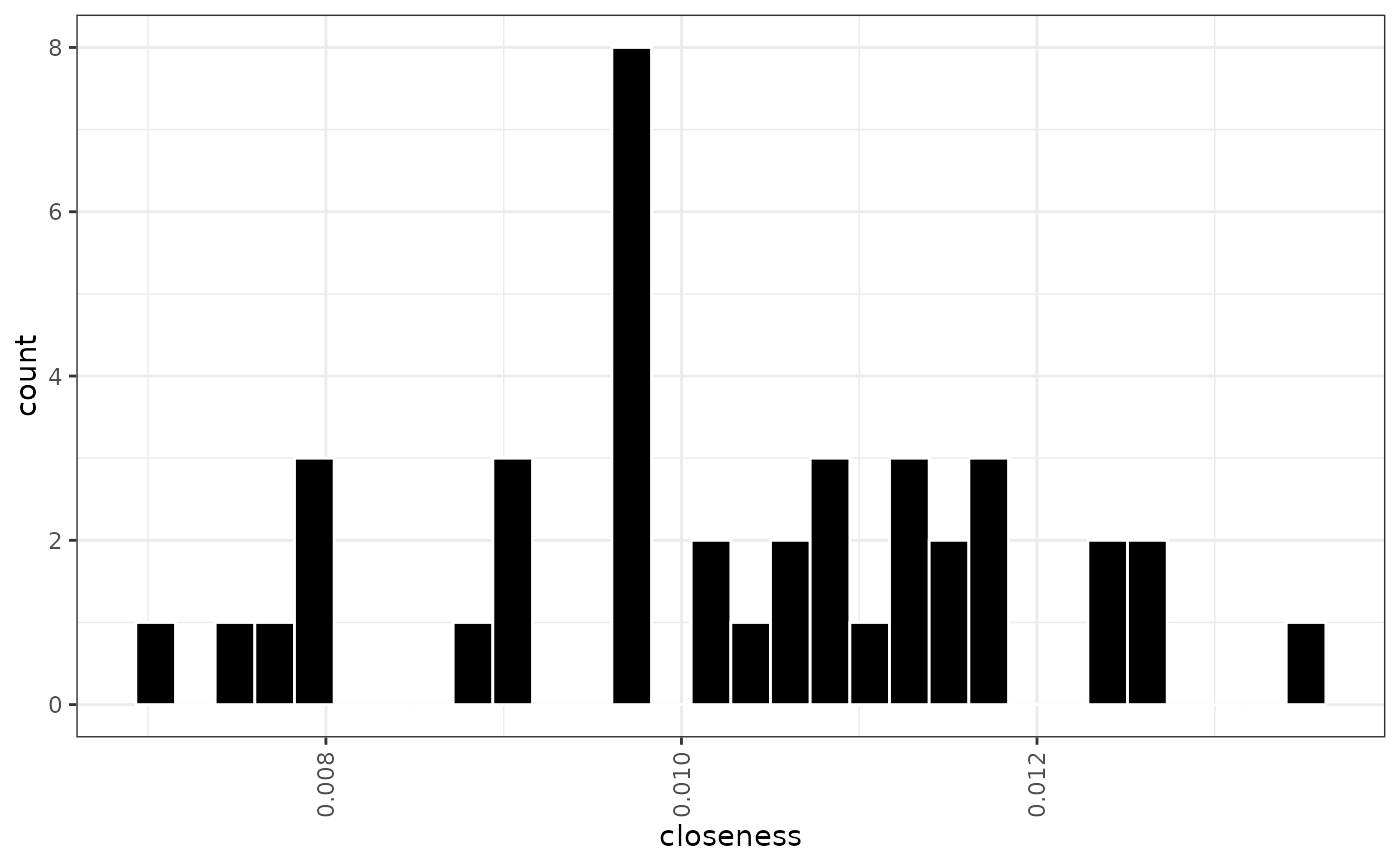
Computes closeness, betweenness and eigenvector centrality for every vertex
of g and plots the chosen measure. Without facets a histogram of the
measure is drawn; with facets a boxplot is drawn for each combination of
the facet attributes, ordered by the median of the measure.
Arguments
- g
An igraph object.
- measure
Name of the centrality measure to plot. Either a vertex attribute of
g(e.g.".degree") or one of the computed measures:"closeness","betweenness"or"eigen_centrality".- facets
Optional character vector of vertex attributes to group by.
- rotate
If
TRUE, rotate the x-axis labels by 90 degrees.