R/plot_homophily.R
plot_homophily.Rd
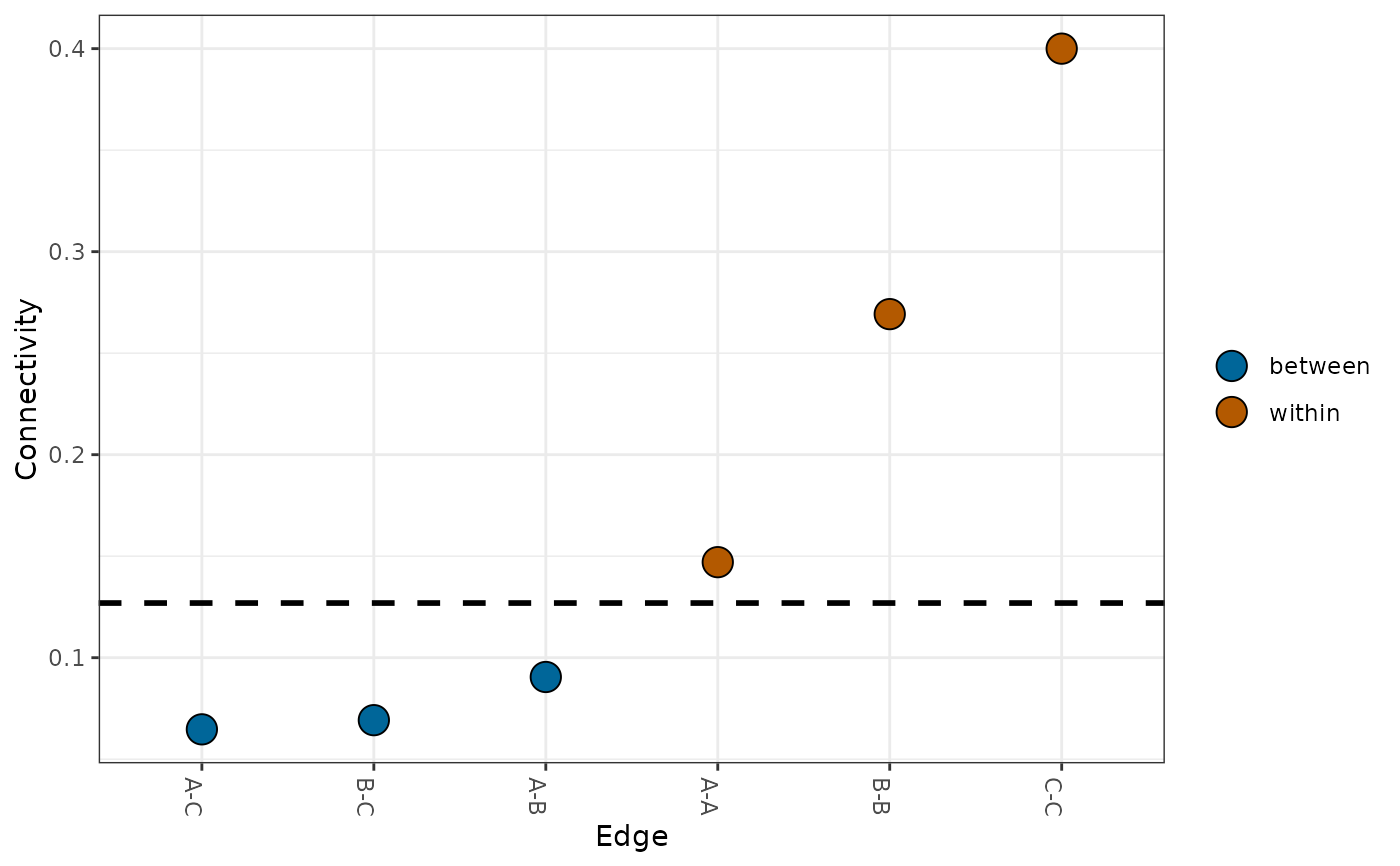
Plot homophily
plot_homophily(RM, show_sign = FALSE, filter_sign = FALSE)
Ringbauer tibble
boolean on whether to colour by significance
boolean to show only significant edges
Plot of homophily density
get_ringbauer_measures(example_network, "site") |> plot_homophily()