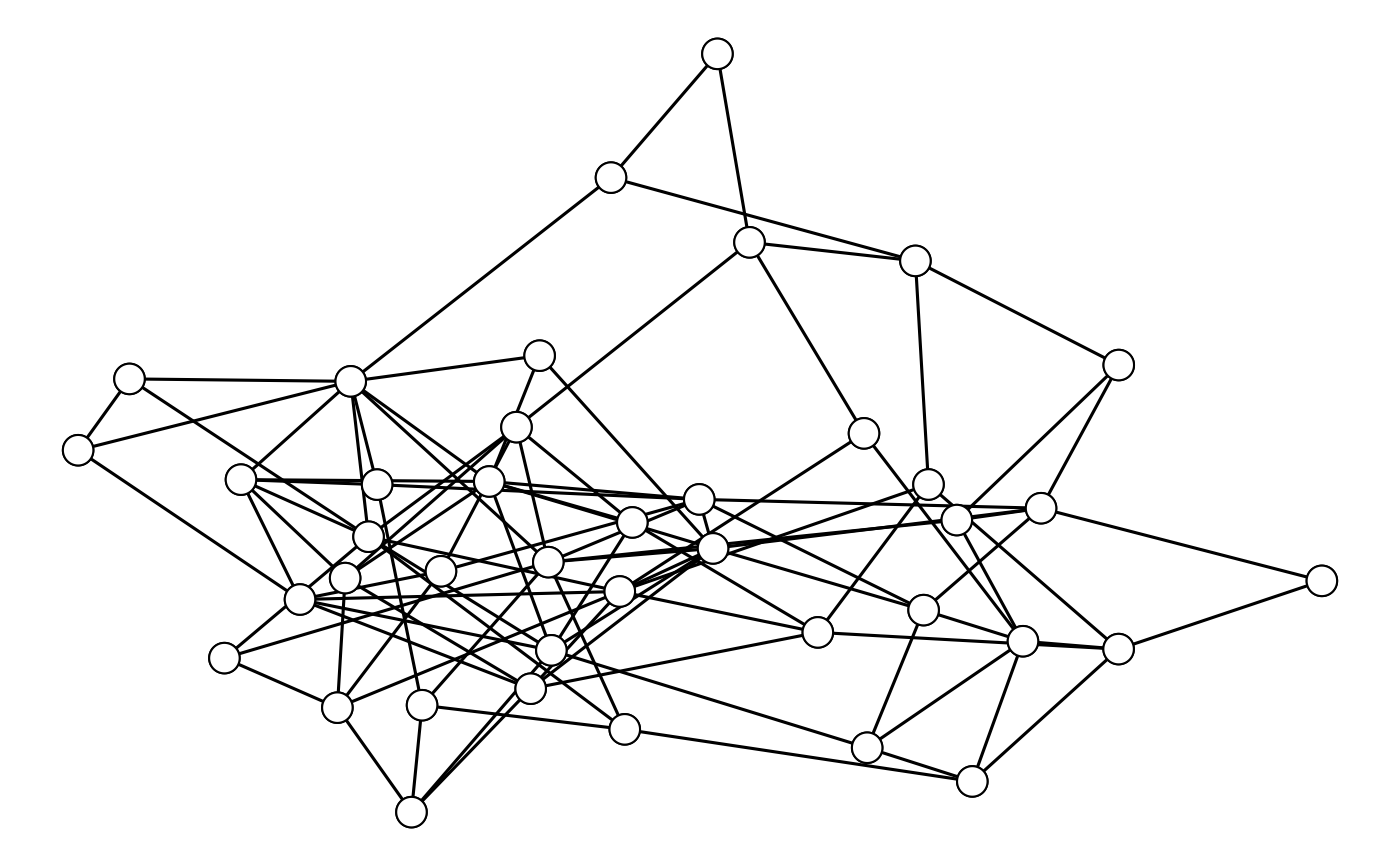
Plot a network
Usage
plot_network(
  g,
  seed = 2026,
  connected = "Show",
  lat = "none",
  long = "none",
  edge = "none",
  edge_legend = TRUE,
  edge_trans = "identity",
  label = "none",
  label_filter = "none",
  label_size = 4,
  label_inc = "",
  label_exc = "",
  label_col = "black",
  fill = "none",
  shape = "none",
  size = "none",
  node_size = 5,
  pal = "ravenclaw"
)
Arguments
- g
An igraph network.
- seed
Random seed used for the node layout.
- connected
How to treat unconnected (isolated) nodes: "Show" leaves them as they are, "Hide" removes them from the plot, and "Grey out" draws them (and their labels) with an alpha of 0.1. The layout is always computed on the full network, so the other nodes don't move.
- lat, long
Vertex attributes holding latitude and longitude. Supply both to use a geographic layout, or neither for a force-directed layout.
- edge
Edge attribute mapped to line width (numeric) or line type (anything else).
- edge_legend
Show the edge legend?
- edge_trans
Transformation applied to a numeric
edgemapping.- label
Vertex attribute used for node labels.
- label_filter
Vertex attribute that
label_inc/label_excare matched against. Defaults tolabel.- label_size
Label text size.
- label_inc
Regular expression; only labels matching it are shown.
- label_exc
Regular expression; labels matching it are hidden.
- label_col
Colour of label
- fill
Vertex attribute mapped to node fill.
- shape
Vertex attribute mapped to node shape.
- size
Vertex attribute mapped to node size.
- node_size
Base node size.
- pal
Colour palette name.