Plot single ergm coefficients
Examples
ergms <- get_ergms(
example_network,
preds = c("site", "genetic_sex"),
types = c("nodematch", "nodemix")
)
#> Starting maximum pseudolikelihood estimation (MPLE):
#> Obtaining the responsible dyads.
#> Evaluating the predictor and response matrix.
#> Maximizing the pseudolikelihood.
#> Finished MPLE.
#> Evaluating log-likelihood at the estimate.
#>
#> Starting maximum pseudolikelihood estimation (MPLE):
#> Obtaining the responsible dyads.
#> Evaluating the predictor and response matrix.
#> Maximizing the pseudolikelihood.
#> Finished MPLE.
#> Evaluating log-likelihood at the estimate.
#>
#> Starting maximum pseudolikelihood estimation (MPLE):
#> Obtaining the responsible dyads.
#> Evaluating the predictor and response matrix.
#> Maximizing the pseudolikelihood.
#> Finished MPLE.
#> Evaluating log-likelihood at the estimate.
#>
#> Starting maximum pseudolikelihood estimation (MPLE):
#> Obtaining the responsible dyads.
#> Evaluating the predictor and response matrix.
#> Maximizing the pseudolikelihood.
#> Finished MPLE.
#> Evaluating log-likelihood at the estimate.
#>
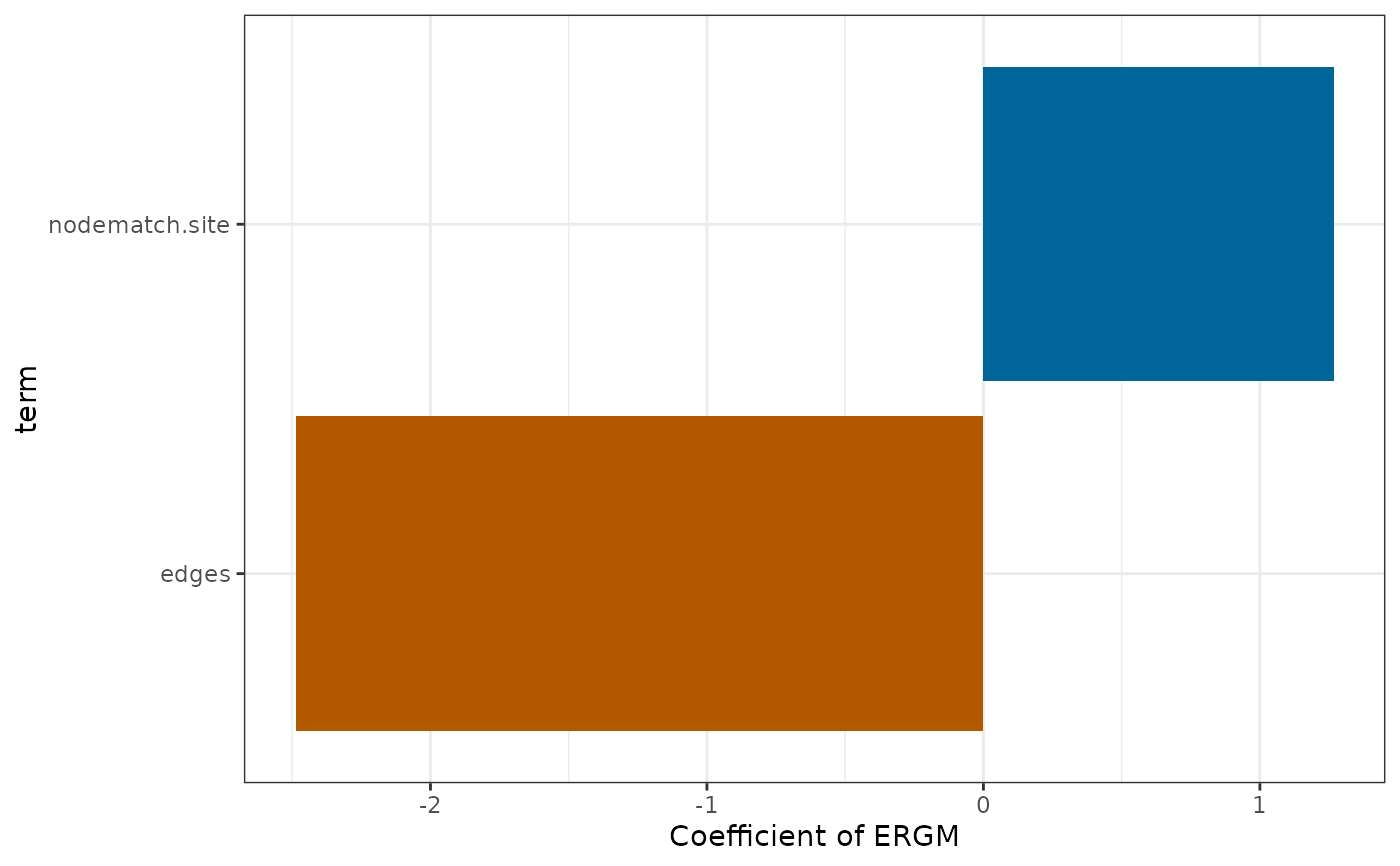
ergms[[1]] |> plot_single_ergm_coef()